Request and Error
When you create a website in Azure, you automatically got some monitoring. Go on portal.azure.com (the preview portal), and select your website.
This will be useful to see how many requests and errors you got. You could create some alerts, by clicking the "+" sign, and you would be notified by e-mail if the number of request is greater than x, over the last hour.
Analytics
The first time you will click on this section all the instruction will be given to you.To collect end-user usage analytics about your application, insert the following script into each page you want to track. Place this code immediately before the closing </headtag, and before any other scripts. Your first data will appear automatically in just a few seconds.To get analytics for the whole web site, in an Asp.Net MVC site, a good place will be:
\Views\Shared\_Layout.cshtml.In a Ghost blog, if you are using the default theme, the file will be
/content/themes/casper/default.hbs. Otherwise, just replace "casper" by your theme name in the path.Once your website is re-deployed, re-open the website blade and click again on the Analytics graph. And you will be able to see a lot of information: Session per browser, information on page's views, slowest pages, details on sessions, etc.

When you click on a graph, the Metrics Explorer blade will be visible. On the top of this blade, you will have many different options to customize your results. You will be able to add a chart, change the time range, add some filter and even set some alerts.

Moreover, if you click on those Charts, tables or even on a row, you will have more details and options to fine-tune the result.

Application Insights
You thought it was enough? Well, Microsoft Azure still has one more tool for you, that will cover in this post: Application Insights. With this one, you will be able to see the health of your application by adding some tests, custom events, logs, errors, etc.Adding Application Insights to your Asp.Net website, can easily be done via Visual Studio, like I explained in a previous post.
Since Azure is compatible with many different languages, chances are that you are using one of those. Let say you are running a node.js Ghost blog, how could you add Application Insights? By using website extensions. To add an extension you could use the Kudu interface. This interface is easy to access. In a browser, type the URL of the website but inject "scm" between the name of the application and the azurewebsites.net. Something like http://mybookmanager.scm.azurewebsites.net/

Once you are in the Kudu interface, click on the tab Site Extensions, then section Gallery. Add the Application Insights Extension.
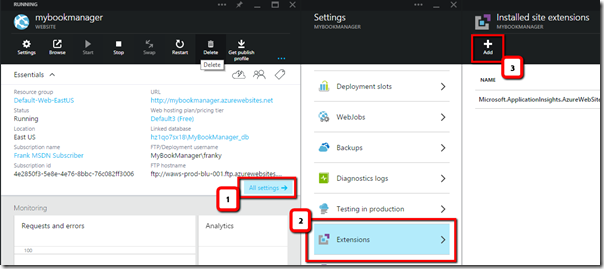
It's also possible to add a website extension using the website blade.

This will gives you a lot of information already, but to add more customs metric in .Net by sure to add the Application Insights SDK to your porject. In node.js use the applicationinsights package from npm,
~Frank Boucher
References
- Microsoft Azure
- Ghost
- Application Insights Extension
- Write custom telemetry with Application Insights API
- Applicationinsights package (npm)
- Kudu
